BP: Diversity and Inclusion
Role: Strategy, UX, UI, Art direction
BP came to us to think of an innovative way to promote and encourage inclusion amongst their employees, and in turn help promote the need for diversity amongst their hiring managers.
Internal research conducted at BP profiled their employees as being:
Low on sensitivity and empathy
Logical thinkers
Prone to a “macho” culture on oil rigs
Not aware of the affects discrimination can have
Finding traditional training resources “preachy”
The Brief
To create a training resource to reach this audience and educate, without them realising it is educational.
How did we do it?
The ‘In their shoes’ challenge was designed to encourage teams to be more empathetic, to understand their own behaviours and the impact that they have on others – and in turn boost their team performance.
As an overview of the workshop which took place in teams at BP, the final experience was divided into three main sections:
The digital quiz, profile, advice and tips cards
An interactive conversation, where the team chooses the direction of the conversation
(Tilt filmed an employee at BP, a trans woman called “Bobbi” asking her questions about her life experiences, discrimination that she has faced and any challenges.)A post video discussion, where employees collaborate to find workplace solutions (nb - this workshop was led by a facilitator at BP)
My role
The head of strategy approached me with the interactive story concept, and asked me to create something for the post video workshop to enable smoother discussions and help build an inclusive atmosphere amongst the team.
Strategy / Ideation phase
We all have different communication styles which could either foster or inhibit feeling of inclusivity amongst our colleagues at work. I needed a way to define these different communication styles and build a profile of how these may play out in a group setting.
Define
Ascertain communication styles
Educate employees on their style
Understand how this plays out in a group dynamic
Aim
Bring awareness
Affect behavioural change
Foster an inclusive environment
Research and defining quiz metrics
Research for the communication styles
I started by researching personality theory in Psychology, and focus on trait based as this is measurable.
Traditionally you have the big 5:
Openness
Conscientiousness (responsible, organized, hard-working, goal-directed, and to adhere to norms and rules)
Extraversion
Agreeableness
Neuroticism
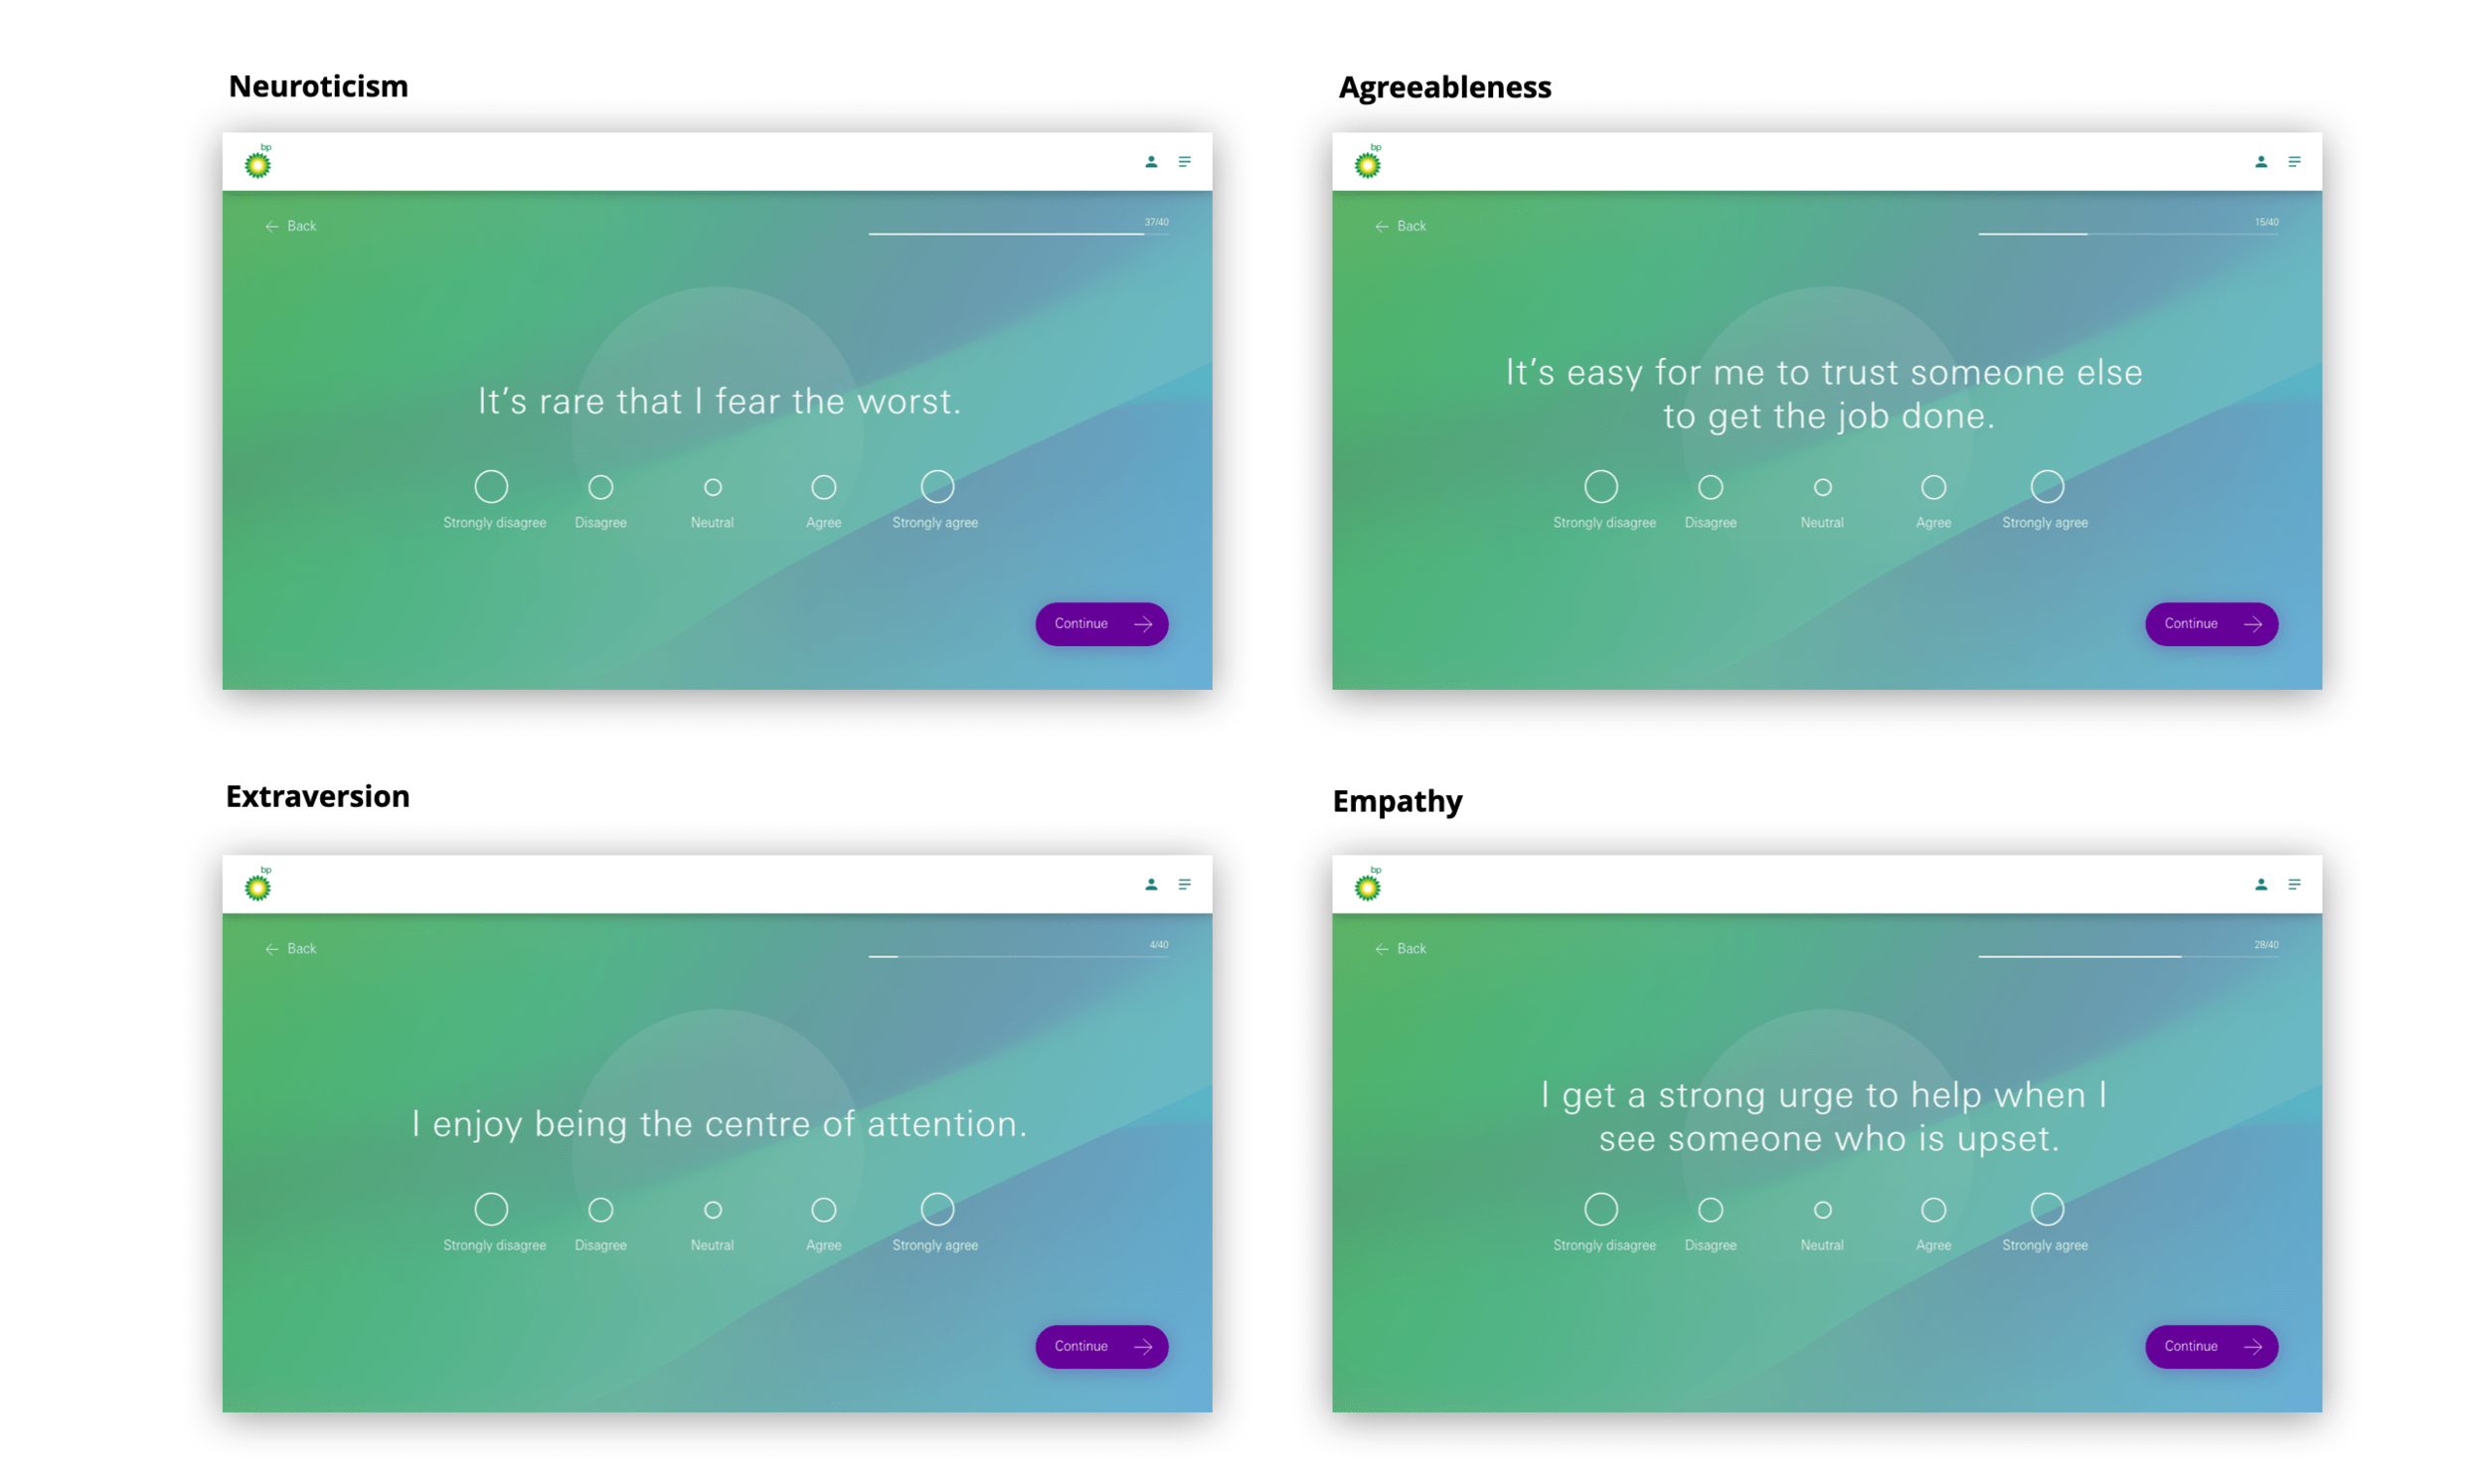
Defining the metrics for the categories
I had to keep the quiz as simple and as “lite” as I could, so for the purpose of tailoring this specifically for workplace communication styles; I chose these metrics:
Extraversion (loud vs quiet)
Agreeableness (want to get along vs rocking the boat)
Neuroticism (anxious vs care free)
Empathy
Defining quiz outcomes
Defining the categories of communication styles
As these are binary scales of traits (0,1 - e.g extraversion or introversion) I created a collection of personality profiles based on a specific combination of 0’s and 1’s of the 4 metrics: Extraversion, Agreeableness, Neuroticism, Empathy.
To keep this experience light I created only four communication styles, and to keep this neutral we had a workshop internally with the creative producer and head of strategy for the names of these styles.
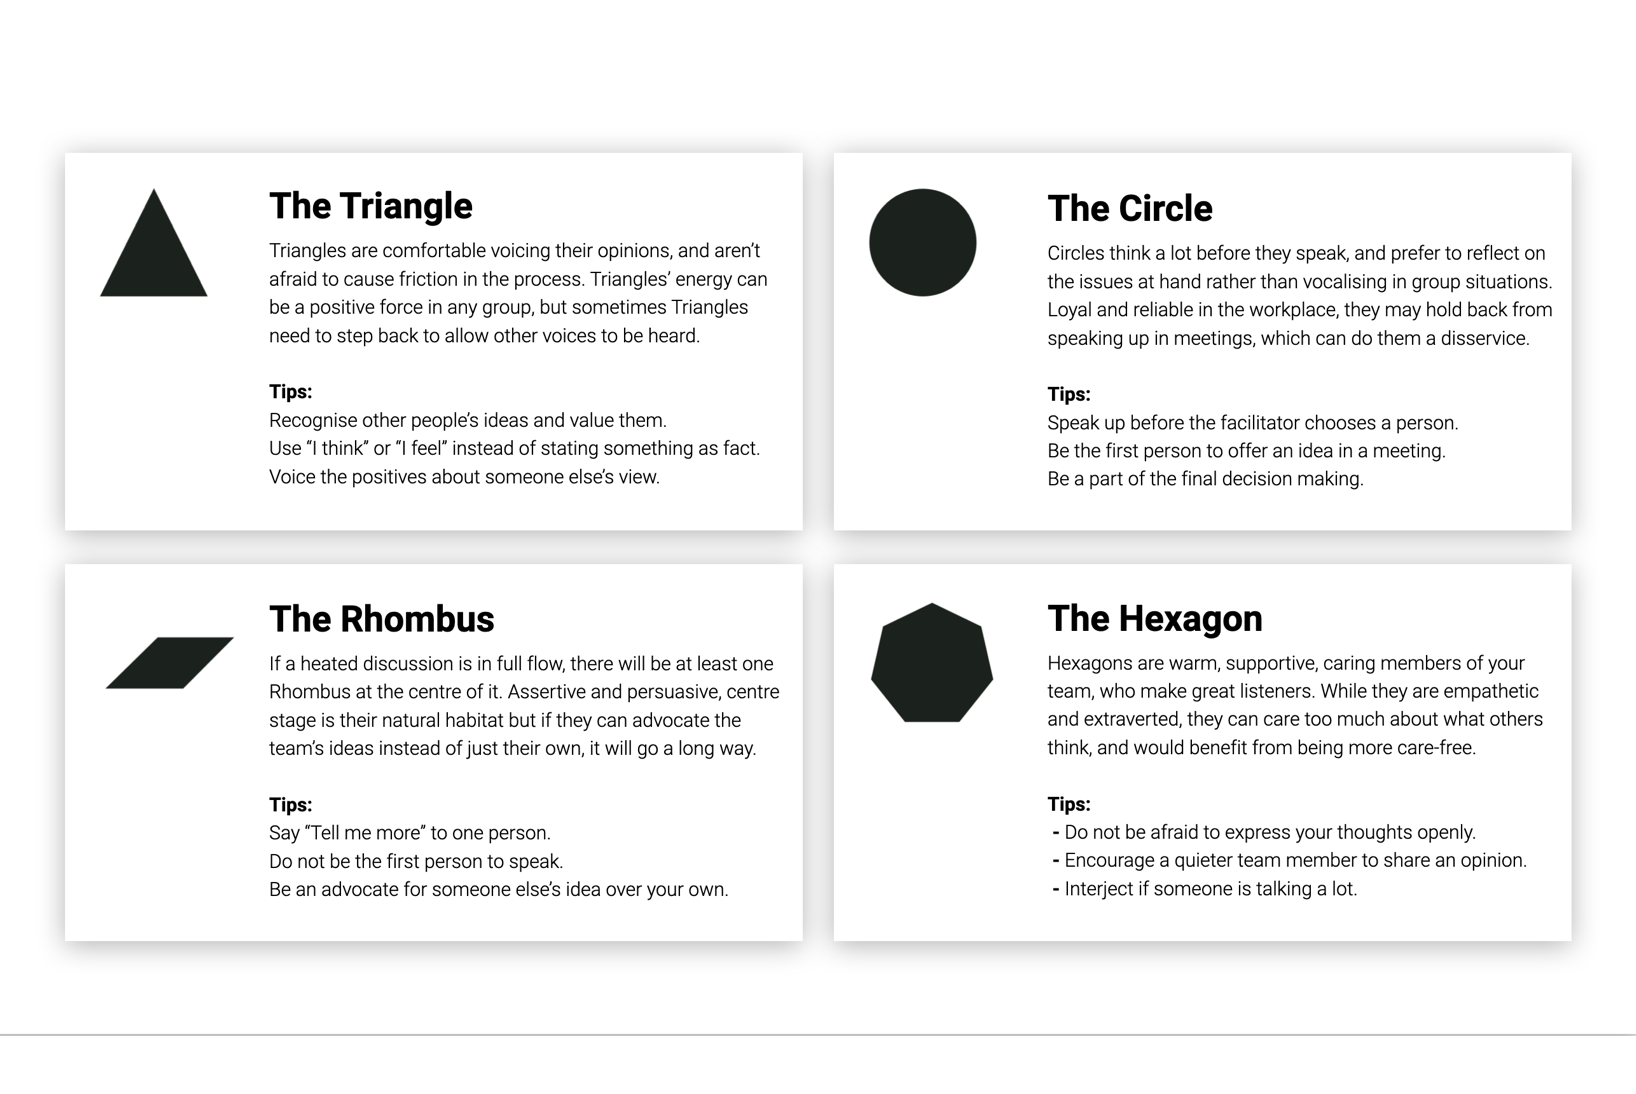
The 4 communication style categories and scoring are:
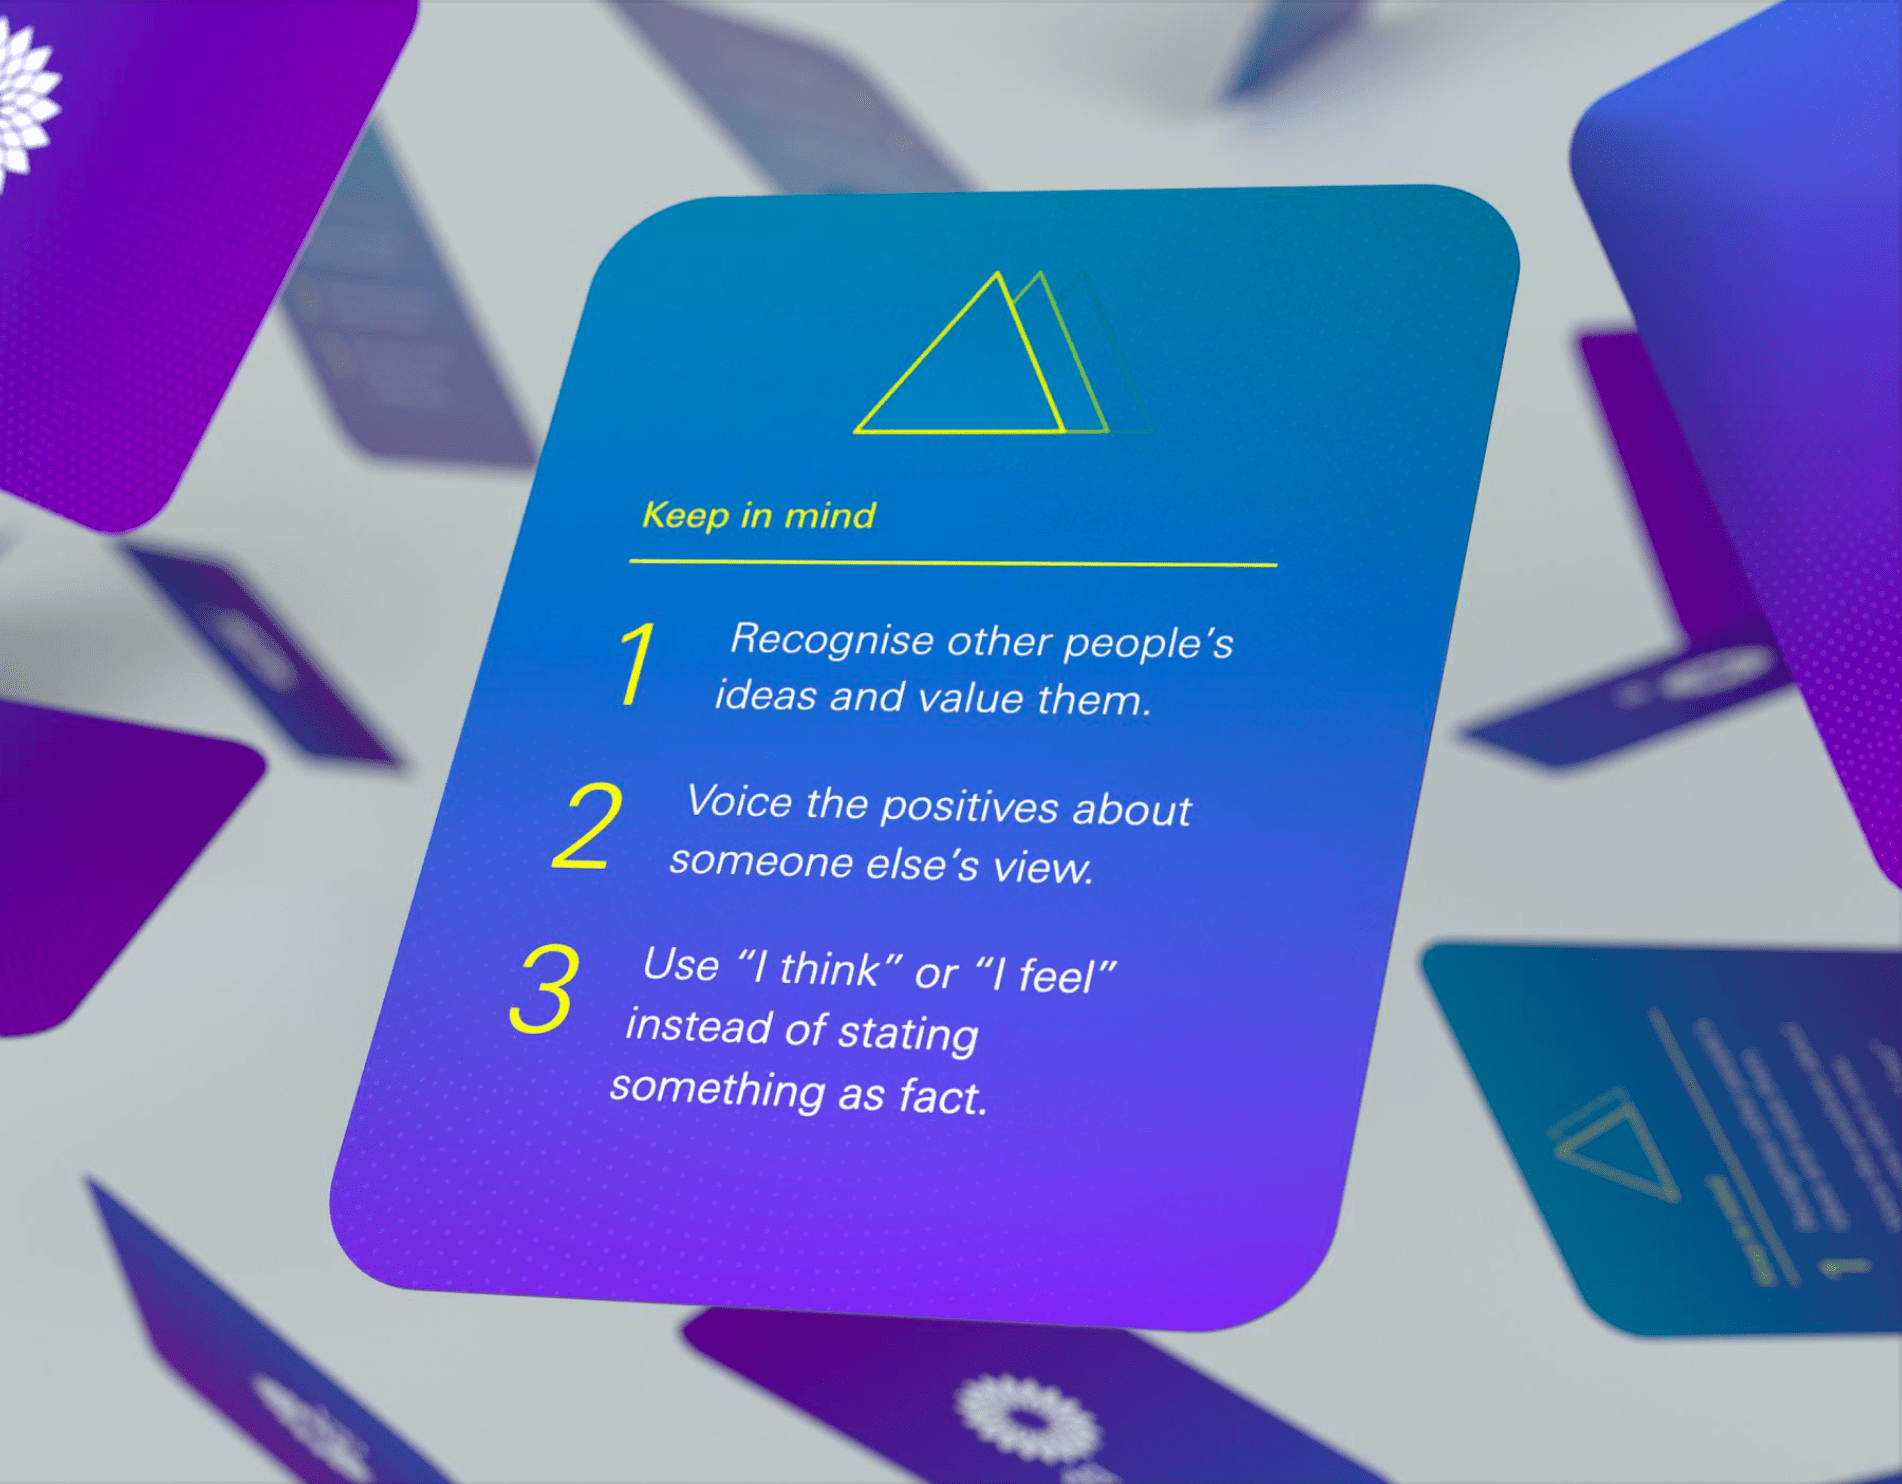
Triangle (Extraversion = low, Agreeableness = low, Neuroticism = high; Empathy = low)
Circle (Extraversion = low, Agreeableness = high, Neuroticism = low; Empathy = high)
Rhombus (Extraversion = high, Agreeableness = low, Neuroticism = high; Empathy = low)
Hexagon (Extraversion = high, Agreeableness = high, Neuroticism = low; Empathy = high)
As a disclaimer - this is reductive and I do not think people exist in 4 categories. The aim is to create some tailored tips and advice based on a profile that people may relate to.
Cards: copy
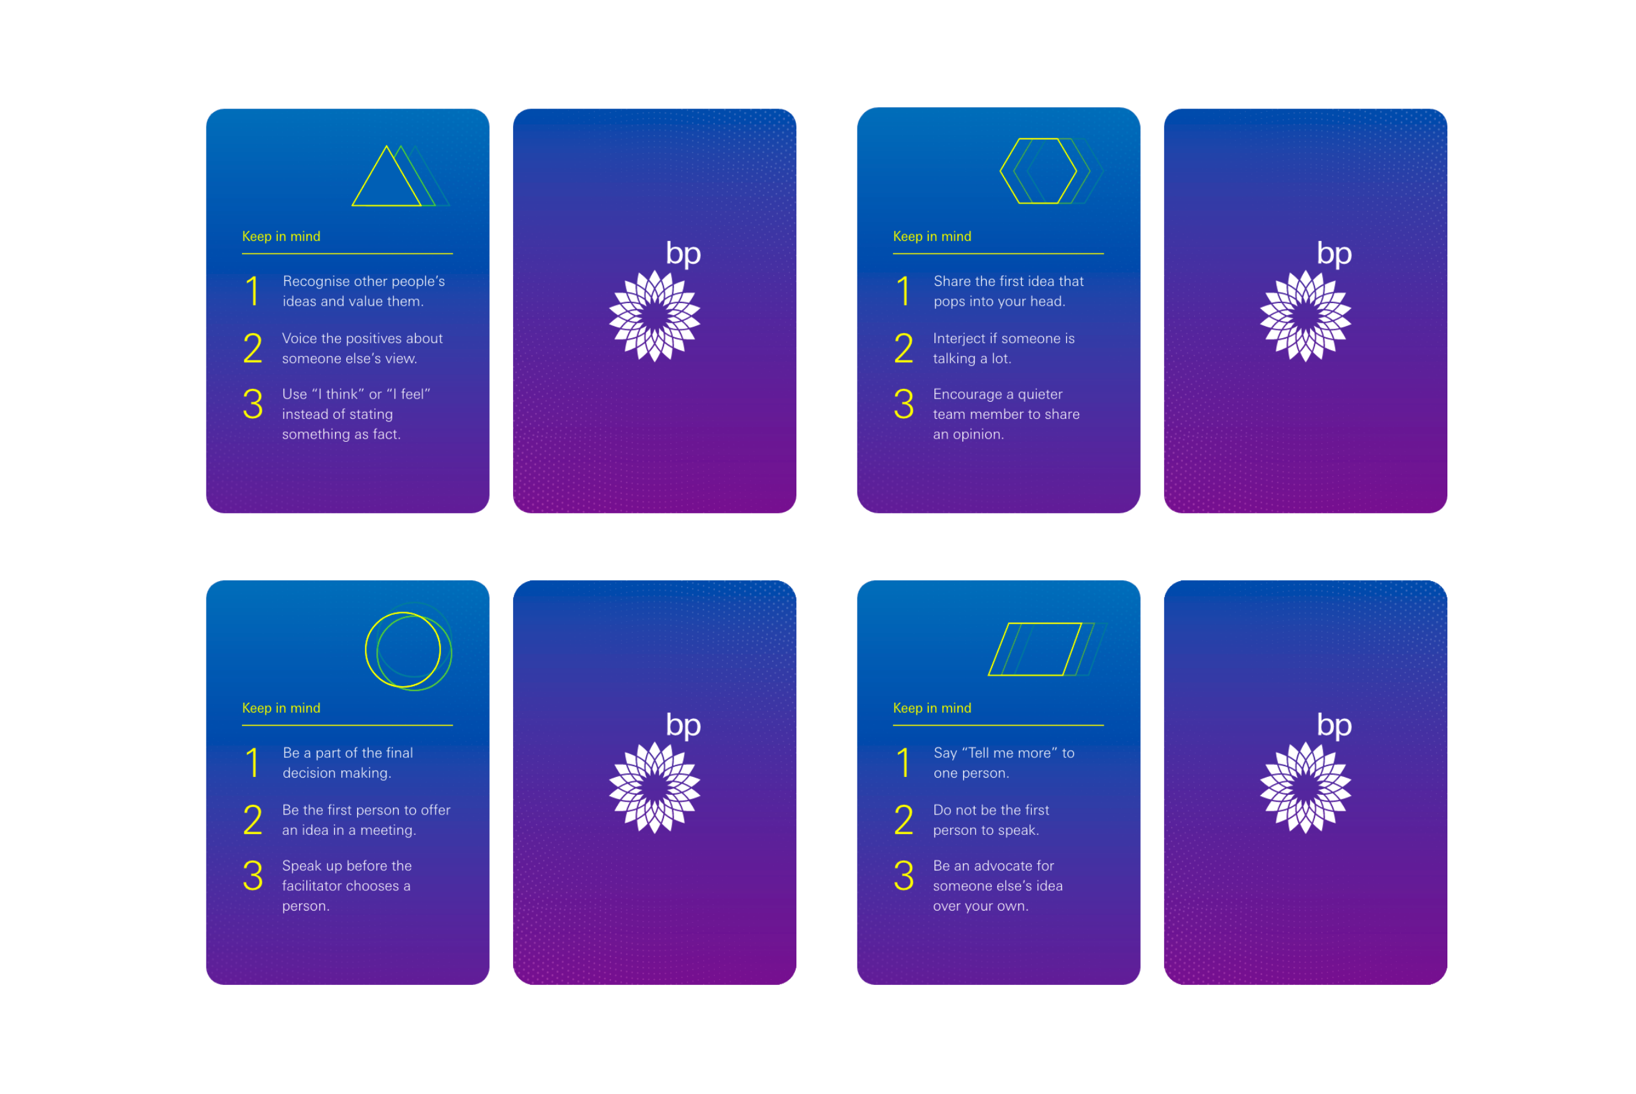
Cards: print design
Process for end result; shape profile and card
Quiz creation:
5’s q’s for each metric
Researched commonly used questions for metrics
Removed any western sentiments, colloquialisms e.g “feeling blue”
Collecting data from quiz prototype
Google forms to google sheets
Transforming data into meaningful categories
Worked with a developer for the best mathematical solution in excel using cosines
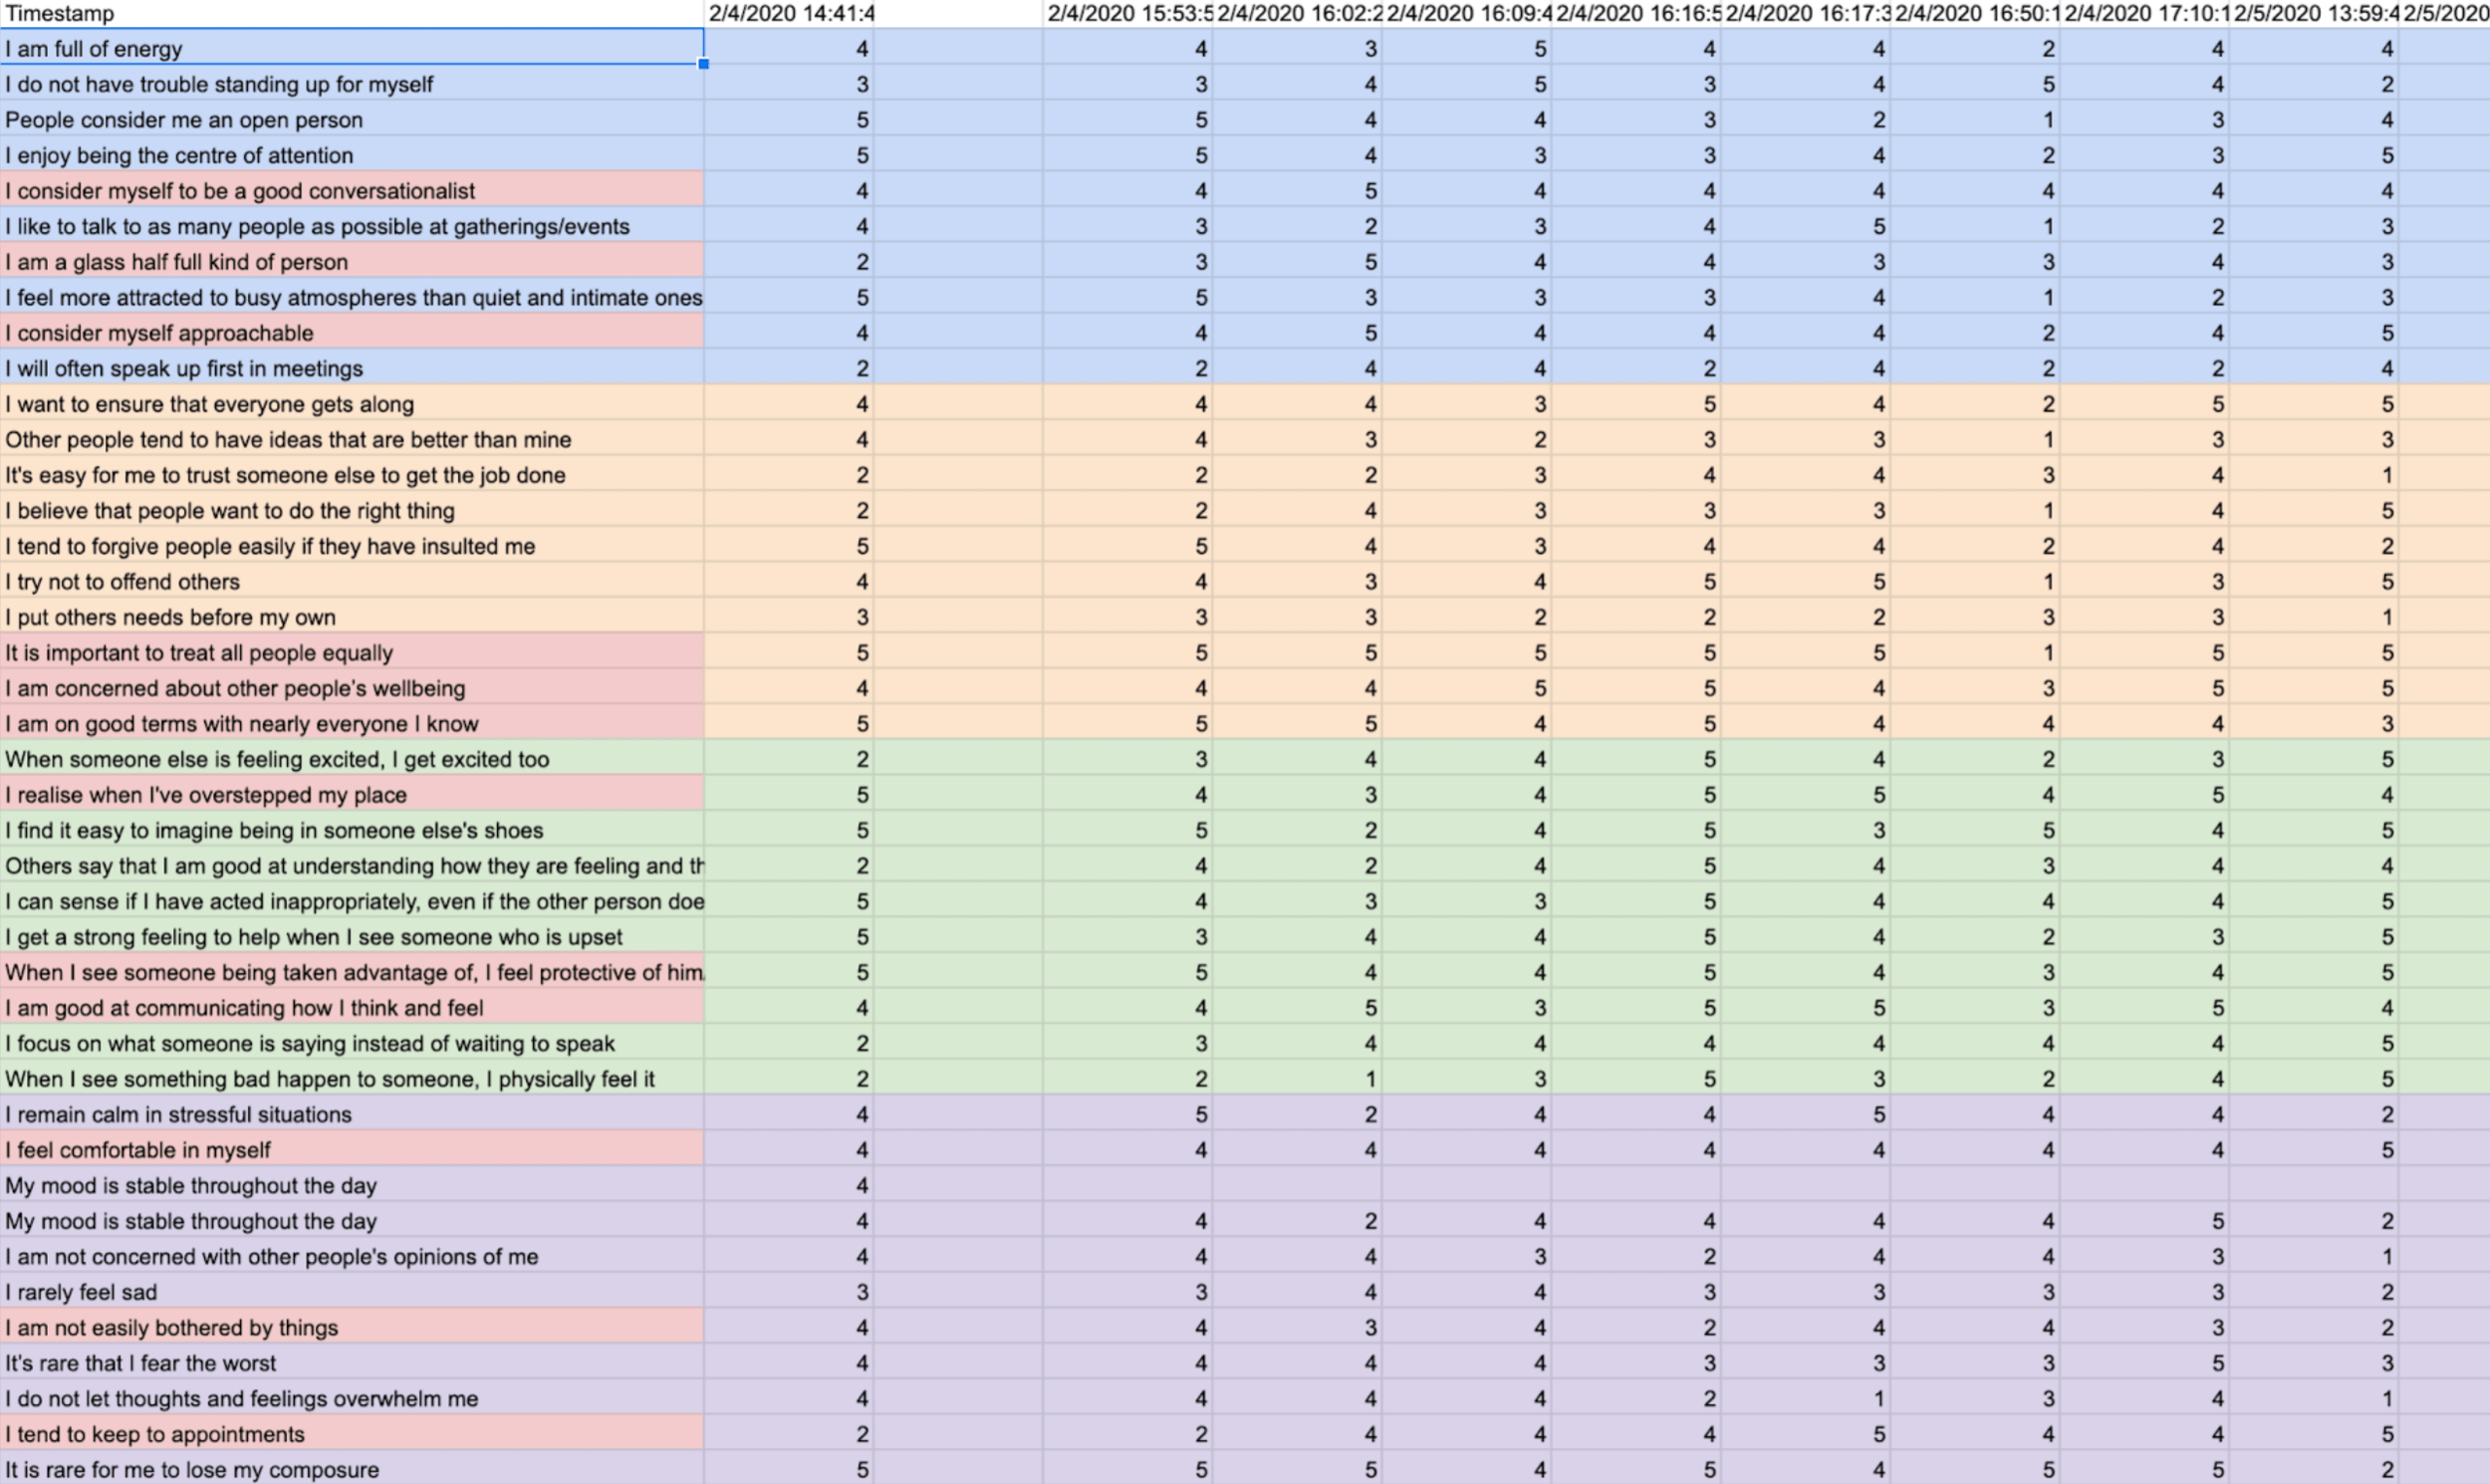
Excel - data input
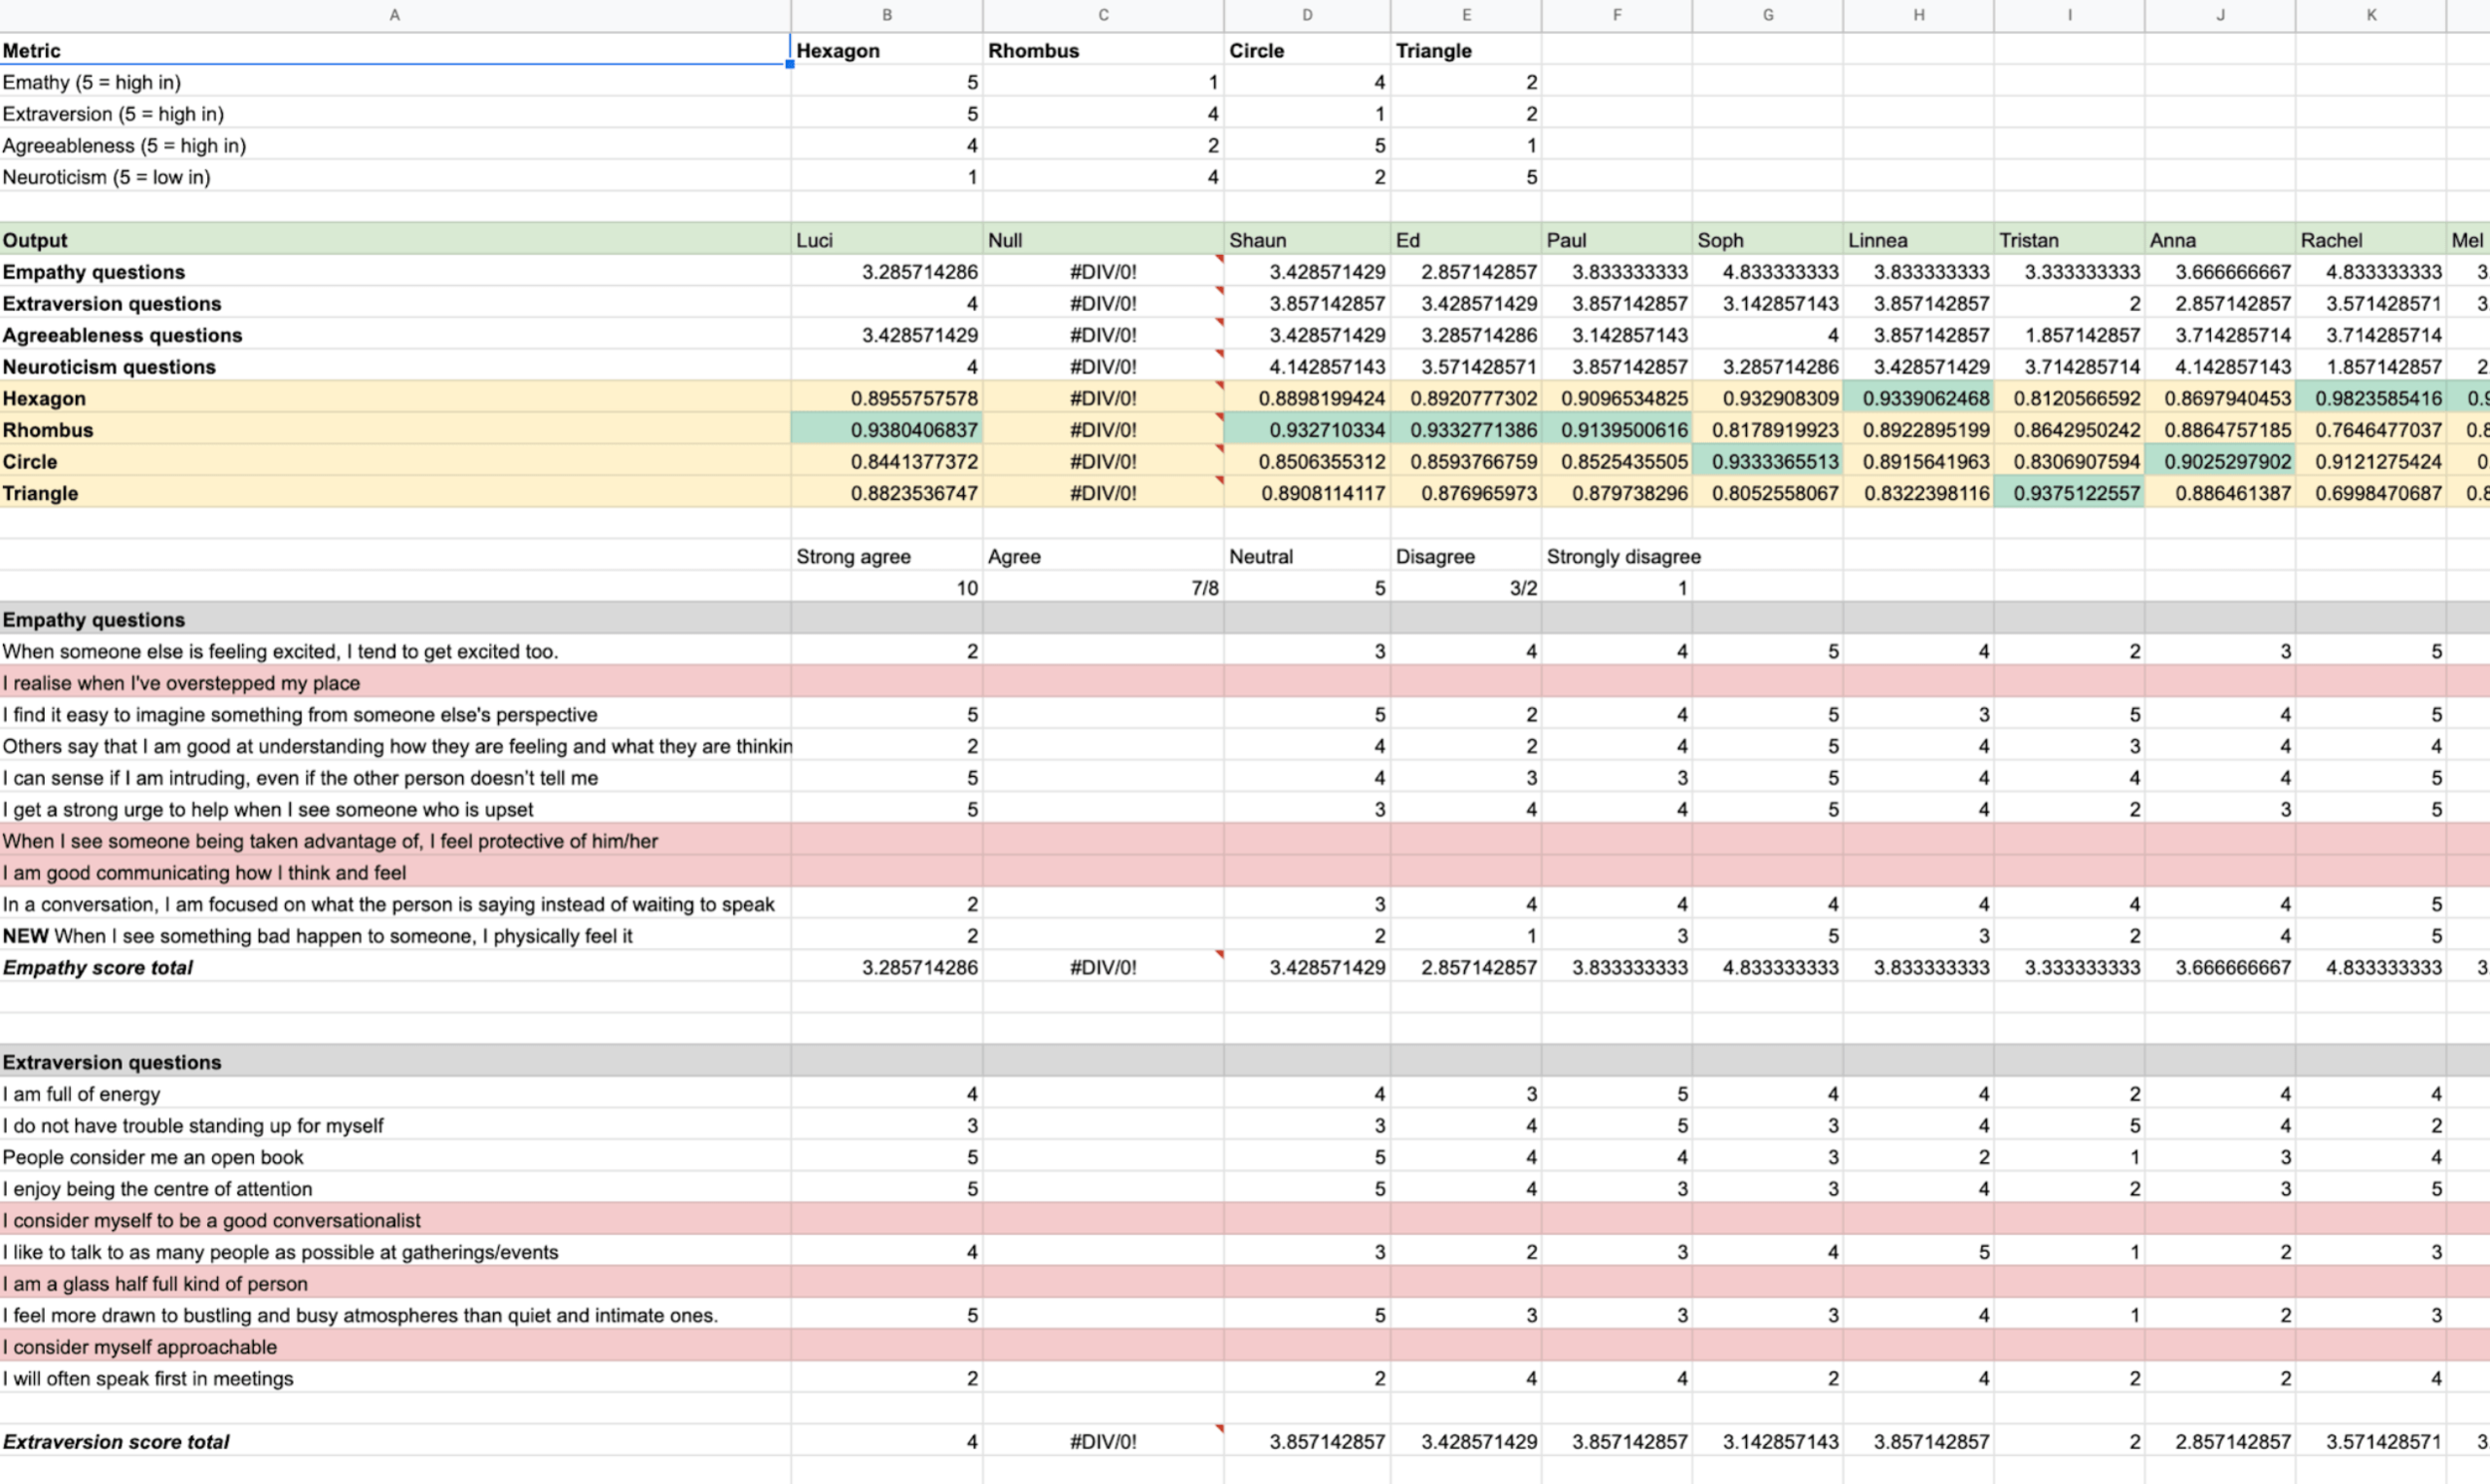
Excel - data output
User testing
We had around 30 employee’s currently in the design studio. To test the scoring of the quiz and to ensure that everyone didn’t land in the same category, I conducted user testing on our internal employee’s at the studio. After this inital round, I tweaking the parameters of the categories based on trends in responses, culling any questions that were outliers to the other answers.
Logistical concerns
The head of strategy was concerned about diversity of communication styles amongst homogenous samples - fortunately, the second round of user testing which I conducted on BP stakeholders showed this not to be the case. Also, more “rhombuses” were found to be in the BP sample as hypothesised, and more “hexagons” internally in our studio, most lilkely due to the higher amount of creatives.
User’s (internally at the studio and externally with BP stakeholders) felt the card profiles and tips resonated with themselves.
Quiz final UI
Results
The initial UK workshop amongst employees at BP was a success!
Positive feedback from the facilitator
Employee’s felt their cards resonated with them
Most felt that they could utilise their card tips in the workshops
They enjoyed the experienced - wanted to learn more, keen to engage
BP decided the roll this experience globally!